Hybernate
Intelligent Kubernetes workload lifecycle management.
Hybernate is a Kubernetes operator that predicts your workload demand using Holt-Winters forecasting and proactively scales, pauses, or destroys workloads to cut infrastructure costs. It requires consensus across multiple signals before acting, and supports dry run mode so you can observe its recommendations and build confidence before letting it drive actions.
Why Hybernate?
Most Kubernetes clusters run workloads 24/7, even when no one is using them. Dev environments sit idle overnight. Staging clusters burn resources on weekends. Production services stay at peak capacity long after traffic drops.
Hybernate fixes this by learning your workload patterns and acting on them:
- Idle workloads get paused. They are scaled to zero when no one is using them and resumed automatically when demand returns.
- Over-provisioned workloads get right-sized. Replica counts adjust to match actual demand, not worst-case guesses.
- Abandoned workloads get cleaned up. They are destroyed after extended idle periods, with PVC retention for safety.
Key Features
Demand Forecasting
A Holt-Winters double seasonal model learns daily and weekly traffic patterns for each workload. After observing your traffic for a few hours, it starts predicting demand, and its confidence improves over time. If traffic patterns shift, a built-in anomaly detector notices the drift, demotes the model's confidence, and re-learns from the new baseline.
Multi-Signal Consensus
CPU metrics alone aren't enough. Hybernate combines built-in Kubernetes metrics with your own custom PromQL queries (active connections, queue depth, request rates, or anything else you care about) and requires all signals to agree before taking action.
Safe by Default
Every action goes through a grace period, signal consensus, and confidence threshold. Enable dryRun mode to see what Hybernate would do without it actually doing anything. Conflict detection catches external changes to your workloads.
Cost Tracking
Track per-workload resource consumption and savings. See exactly how much you're saving from paused, scaled, and destroyed workloads, aggregated across your entire cluster via the HybernateReport.
Auto-Discovery
WorkloadPolicy scans your namespaces, classifies workloads as Active, Idle, or Wasteful, and can auto-create ManagedWorkload resources for the ones that need attention.
GitOps-Native Export
Use kubectl hybernate export to generate ManagedWorkload manifests from discovered workloads, ready to commit to Git and deploy via ArgoCD or Flux.
Full Observability
Prometheus metrics for every lifecycle transition, prediction confidence score, cost saving, and scale event. Grafana dashboards and alerting rules included.
How It Works
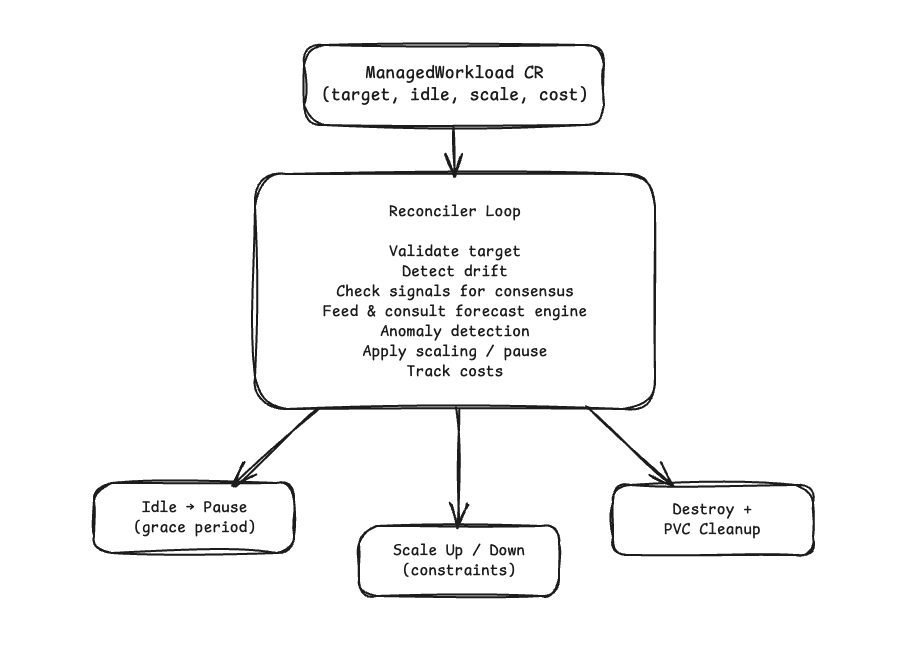
Quick Example
| managedworkload.yaml | |
|---|---|
This watches the my-api Deployment and pauses it when both CPU and memory stay below 10% of their respective requests for 10 minutes. The forecast engine learns daily and weekly patterns and must agree before any action is taken.
For scaling policies, custom PromQL signals, cost rate overrides, and the full spec, see the ManagedWorkload Guide.
Getting Started
Ready to try it? Head to the Installation guide, then follow the Quickstart to manage your first workload in under 5 minutes.